![]() Database
schema for RIMapper system
Database
schema for RIMapper system
1 database = 1 WMS instance
In RIMapperWMS, most configuration is done using database tables. The system can simultaneously serve multiple WMS 'instances', each from a separate database. An instance can be created by installing a(nother) copy of the RIMapperWMS servlets as a web application in your servlet container. In most Java servlet containers, this would be a folder in the webapps directory. Inside this directory, the DB connection particulars are in a file called 'wms_instance.xml'.
You can view the contents of this in any XML or text editor, but since we do not want to store the DB password in plain text, the password field will be encrypted. To change or edit we therefore have included a small web-app in the distribution that takes care of en- and decrypting the password: DefineWMSInstance.html (in the standard distribution you could reach this at http://localhost:8080/RIMapper/admin/DefineWMSInstance.html)
The Database schema should conform to the following minimal setup:
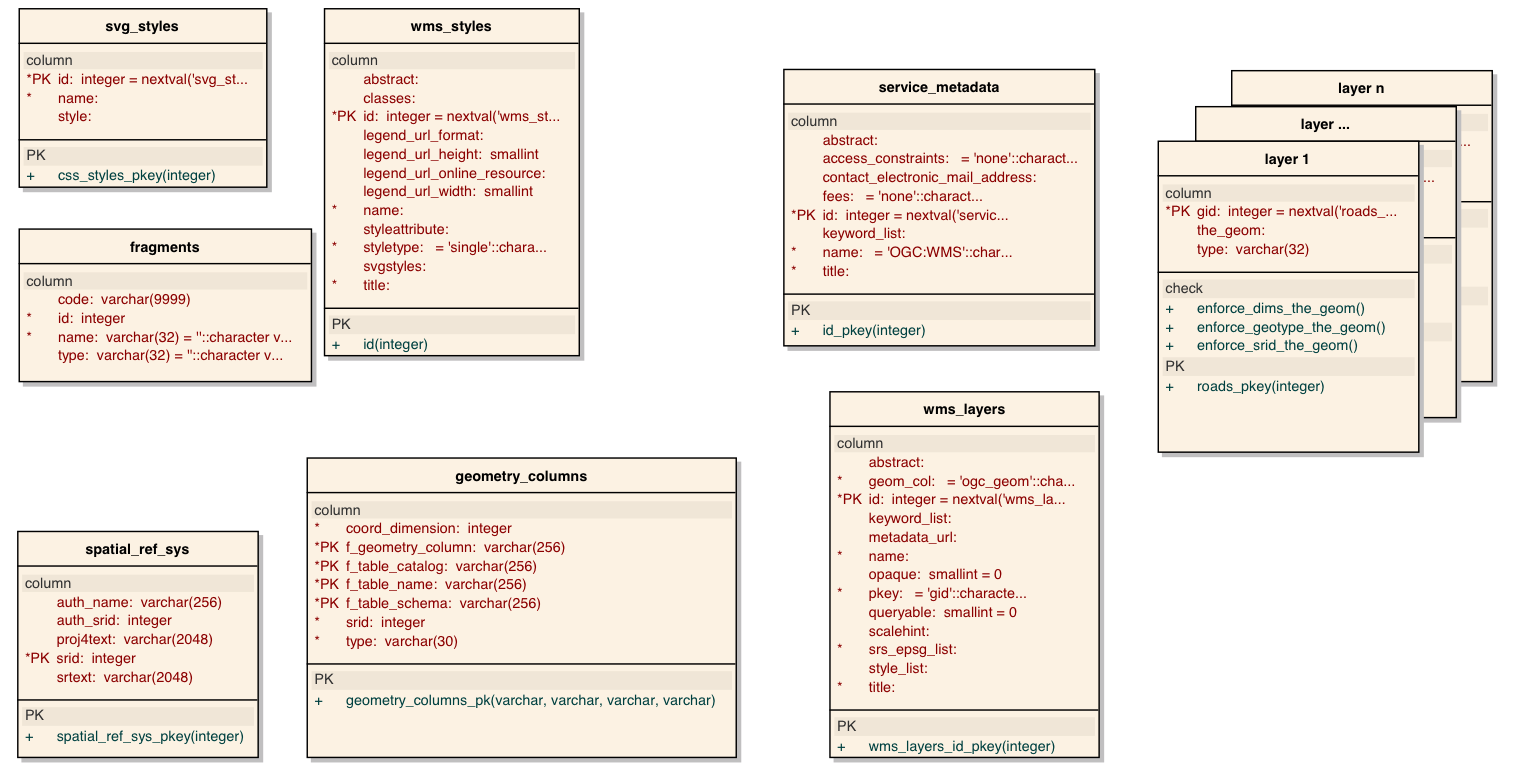
All further configuration is done using the database tables. Setting these configuration tables is currently done by using a generic SQL client. (we hope to later develop web-based configuration pages to make this process more user-friendly).
wms_layers and service_metadata tables
As can be seen in the data model, the central configuration tables are wms_layers and service_metadata. This lists which data sets are available, what their co-ordinate system is, what styles they support, etcetera. Details can be found in the comments of the table in the example database and in the OGC WMS 1.1.1 specification.
layer tables
The actual layer data is stored in n layer
tables, that include the OGC compatible geometry columns and any
attributes available. These layer tables are usually the result of
imports from other data sources, eg. from ESRI shape files through
the PostGIS loader tool.
wms_styles table
The wms_styles table defines
available styles from the WMS perspective. In the wms_layers
table, a list of available styles is set per layer; These refer to
styles by their unique names, as found in the name
column of the wms_styles table.
The name column should be unique and short, for a more verbose
description you can use the title
and abstract columns. The former
is the layer name as will be shown in the layer menu, the latter a
description that will be shown when users click on an object using
the info tool.
The styleattributes column can
remain empty, but any names that do appear in here should be in a
(comma-delimited) list of attribute names that refer to the column
name of the attribute in the corresponding layer
table; the values will be added to the SVG objects created in the
map. These values will be shown when users click on the object in
the map with the Info button.
There are three types of styles in the wms_style table, as denoted by the entry in the styletype column:
- single type styles are used to give all features in a layer the same visualisation. In that case:
- the styleattributes
column can remain empty;
- the classes columns must remain empty;
- the svgstyles
column only has one entry, the name of the style from
the svg_style table to be
used.
- chorochromatic type styles are used to classify features in a layer by an attribute and give each class a different visualisation. In that case:
- the first entry in the list in the styleattributes column holds the attribute name that will be used to classify the layer object;
- the classes column holds a (semi-colon delimited) list of the attribute values corresponding to the classes;
- the svgstyles column has a (semi-colon delimited) list that has a style name for every class.
- animate is a
special style to render an SVG layer that is animated, i.e.,
that reflects a change over time in the data as change in
representation time (according to some time scale, where for
example 1 year is depicted in 1 second). Note that currently
only POINT type layers can be animated. In this case:
- the first entry in the (comma-delimited) list in the styleattributes colum names the attribute that will be used to group objects. In other words, if you have several instances of the same object at different times, this column in the layer's table should have the same entry.
- the second
entry in the list in the styleattributes
column names the attribute that holds the time that will be
used to animate. This column in the layer's table should
contain a ISO:8061 compatible date-time string.
- the classes column must remain empty;
- the svgstyles column only has one entry, the name of the style from the svg_style table to be used.
svg_styles defines underlying SVG
graphic styles. The styles are defined using SVG attribute
strings. In principle any valid SVG styling that is appropriate
for the graphics objects that the layer is made up of can be used.
Simple examples would just include graphics styling (eg.
fill="rgb(150,150,150)" stroke="rgb(0,0,0)" stroke-width="0.05"
fill-opacity="0.5"), but more elaborate styling (eg. using
animation or ecmascript event triggers) can also be achieved.
There is a special styling attribute needed in case of POINT or MULTIPOINT data layers. Since points can only be really mapped using symbols, the system uses circles to depict the points. To specify the radius of the circle to be used, you should use the non-standard style rim:radius for that. Since that is not in the svg namespace it will be ignored in the actual styling, but used in the server to create circles of the specified size. You can use any valid size attribute for it, so rim:radius='1' will size circles in the local coordinate system of the map (eg. meters), whereas rim:radius='0.7%' will make circles sizes relative to the viewbox size.
The columns maketrack, trackstyle
and animation_duration are only
used for layers with styletype
animate (see above). maketrack is a
boolean, when TRUE the system will create tracks that depict the
paths travelled by the point data through time. The tracks will be
rendered using the SVG style in trackstyle.
The column animation_duration holds
the time in seconds that the animation initially will take to
finish. This can be changed by the user later.
fragments table
fragments is a multi-purpose table for
SVG & script fragments (eg. GUI elements, interactivity event
handlers, etc.) that are referenced from other parts, most notably
the svg_styles.
wms_cascaded_layers table
Since version 1.0, we also support a table wms_cascaded_layers. This basically holds a link to an external WMS, that will be used as input for a raster layer in the RIMapperWMS output. This way so–called cascaded WMS layers can be offered. Note that the system assumes (does NOT check) that the remote WMS supports PNG output and the SRSs and LAYERs listed in this table! The result will be an <image> element in the SVG file, that holds in its href a url to the WMS service, so the user agent (browser) is responsible for fetching the actual image and renderinging it in the client. Thus these layers are loaded in the background, without checking for succes...
NB: value lists in the tuples are not stored as true SQL arrays, but as text strings with the character ; or , as delimiter between the values!
![]()